Who is Geography A Level suitable for?
- Anyone with an interest in the changing world around them and a desire to develop their own understanding of contemporary issues and challenges affecting the world today.
- People with enquiring minds who enjoy a challenge.
- Those who have enjoyed previous fieldwork opportunities and want to discover more.
- Those who seek an opportunity to develop a wide range of transferable skills.
- Students who enjoy geography at GCSE!
Course summary Hand Out - HERE (Show)
Link to outline of the course - HERE (Show)
Additional Information - HERE
Full A Level Specification - HERE
Taster Activity
Resource - HERE
Slides + Addl. Resource - HERE
Activity:
1. In pairs/small groups: Brainstorm either the term "ecosystem" or "water cycle"... you choose.
2. Attempt to draw a diagram to represent your chosen term. Use the plain paper provided.
3. Feedback...
In attempting to illustrate your chosen term, you have likely used (or begun to use) a "Systems Approach".
A systems approach helps us to understand the physical and human world around us...
...in their basic forms systems are simple to understand, but they also have the capacity to be highly detailed representations, and thus more realistic, models of the real world.
Simple Water Cycle - Here
Complex Water Cycle - Here
They are, then, versatile and potentially sophisticated, capable of being adapted to a wide range of applications.
So, let's look more closely at the systems concept...

We can simplify this to...

4. You have been provided with a similar table of definitions on your table... Read the definitions.
Today we will focus on these parts...


Slides - Here
If time... Follow up - Dynamic equilibrium and Feedback.
The diagram below (which shows a hill slope water cycle) has been used to show the system components of Inputs, Outputs, Stores and Flows.

5. Several scenarios are included in the illustration (in the boxes). Use the systems approach to suggest their effects on different parts of the Hill Slope Water Cycle system... try to explain the reasons. For example, how will farming affect the inputs to or outputs from the system?
6. Suggest how the scenarios illustrate the ideas of dynamic equilibrium, positive and negative feedback...
Example to model... E.g. Urbanisation... might impact on the amount of surface runoff (an OUTPUT). As permeable surfaces are replaced with impermeable, rain water flows as surface runoff (a TRANSFER) into streams and rivers. Increased surface runoff may reduce the amount of evapotranspiration back into the atmosphere (TRANSFER)... will this reduce precipitation (INPUT)? Will rapid surface runoff reduce groundwater (STORE).
If it does... will this process continue to reduce rainfall by positive feedback... or could other urbanisation changes counter this eg pollution leads to greater amounts of condensation nuclei in atmosphere which encourage water vapour to form droplets and precipitate...
Is the system experiencing positive feedback? Is it in a state of dynamic equilibrium?
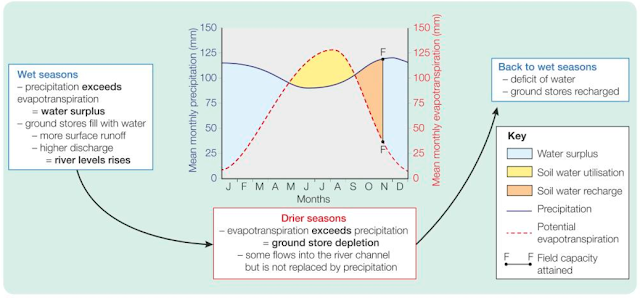
We can use these understandings in more refined and quantitative ways... the graph below, for example, is produced by calculating and measuring values for precipitation, temperatures and evaporation/transpiration rates. Such data can be obtained in raw form by primary or secondary research.
5. What do we learn from it?
Examine the graph...
- what variables are represented?
- how do they change?
- how could the graph be used?

6. Feedback/Discussion:
It reveals the relationship between inputs and outputs and the amount of water that is stored in the soil.
We can see that where precipitation exceeds evapotranspiration water will accumulate in the soil until this store is full (This is known as field capacity).
Once field capacity is reached, further precipitation can no longer be stored and must, therefore, be discharged or transferred... eventually becoming an output from the system through surface runoff and then streamflow.
Seasonal variation in precipitation and temperature (thus evapotranspiration) can lead to loss of water from the soil store (Utilisation) when precipitation is below evapotranspiration. This can deplete the store below capacity... leaving room for additional storage if the balance between evapotranspiration and precipitation shifts once more in favour of precipitation.
How can this information (using the systems approach) be employed to manage flooding or water supply and use?
What we have essentially expressed in the above diagram is a Soil Water Budget ie the balance between water inputs to and outputs from the soil store.
Because the characteristics of places vary considerably, this approach is useful because it is transferable... for example, the same method can be used to quantify the balance between inputs and outputs to understand the capacity of an environment to store water even though things like depth of soil, precipitation, temperatures, air humidity and geology vary significantly...
From this we can begin to understand how much water is available for extraction/use or what the consequences of periods of drought and precipitation may be.
Allied to a wider understanding of factors that influence the movement of water through, for example the Hill Slope Water Cycle, it should be possible to manage changes to river basins. For example, where flooding has increased, but precipitation has remained relatively constant, maybe soil stores are becoming more easily overwhelmed due to reduced outputs from evaporation and transpiration. A solution to the problem, may, thus be to re-afforest the catchment...
...or if Soil Water Stores are declining disproportionately to increasing extraction, could this be a consequence of higher rates of surface runoff due to deforestation and urbanisation... these would reduce infiltration and increase runoff respectively...


No comments:
Post a Comment
Note: only a member of this blog may post a comment.